


Yes, page speed affects SEO, but less than most people are told: Google’s ranking systems use three real-visitor speed measures called Core Web Vitals, and a relevant page still beats a fast one. Where speed hurts most is after the click. A slow page loses the call, the booking and the sale long before Google notices.
So the useful question is not “is my score 100?” It is “do my three numbers pass, and which one do I fix first?” This guide answers both, with Google’s own words, a test of 42 real San Diego dental websites, and a free fix finder that turns your numbers into a to-do list.
How much does page speed affect SEO?
Google says it plainly on its page experience documentation: Core Web Vitals “are used by our ranking systems.” In the same document Google also says it “always seeks to show the most relevant content, even if the page experience is sub-par.” Read together, speed counts, but it does not outrank a page that answers the search better.
The history tells the same story. When Google first added site speed as a ranking signal in April 2010, it said fewer than 1% of search queries were affected. The 2018 mobile “Speed Update” was aimed only at pages that deliver the slowest experience, and Google wrote that a slow page may still rank highly with great, relevant content. Since 12 March 2024, the responsiveness part of Core Web Vitals has been Interaction to Next Paint (INP), which replaced First Input Delay.

Two more lines from Google matter for a small business owner. There is “no single signal” for page experience; Google’s systems look at a variety of signals. And trying to get a perfect score just for SEO reasons “may not be the best use of your time.” In practice that makes speed a deciding factor between pages that are equally helpful, and a pass mark you want to reach, not a race to 100.
What are Core Web Vitals? The 3 numbers Google uses
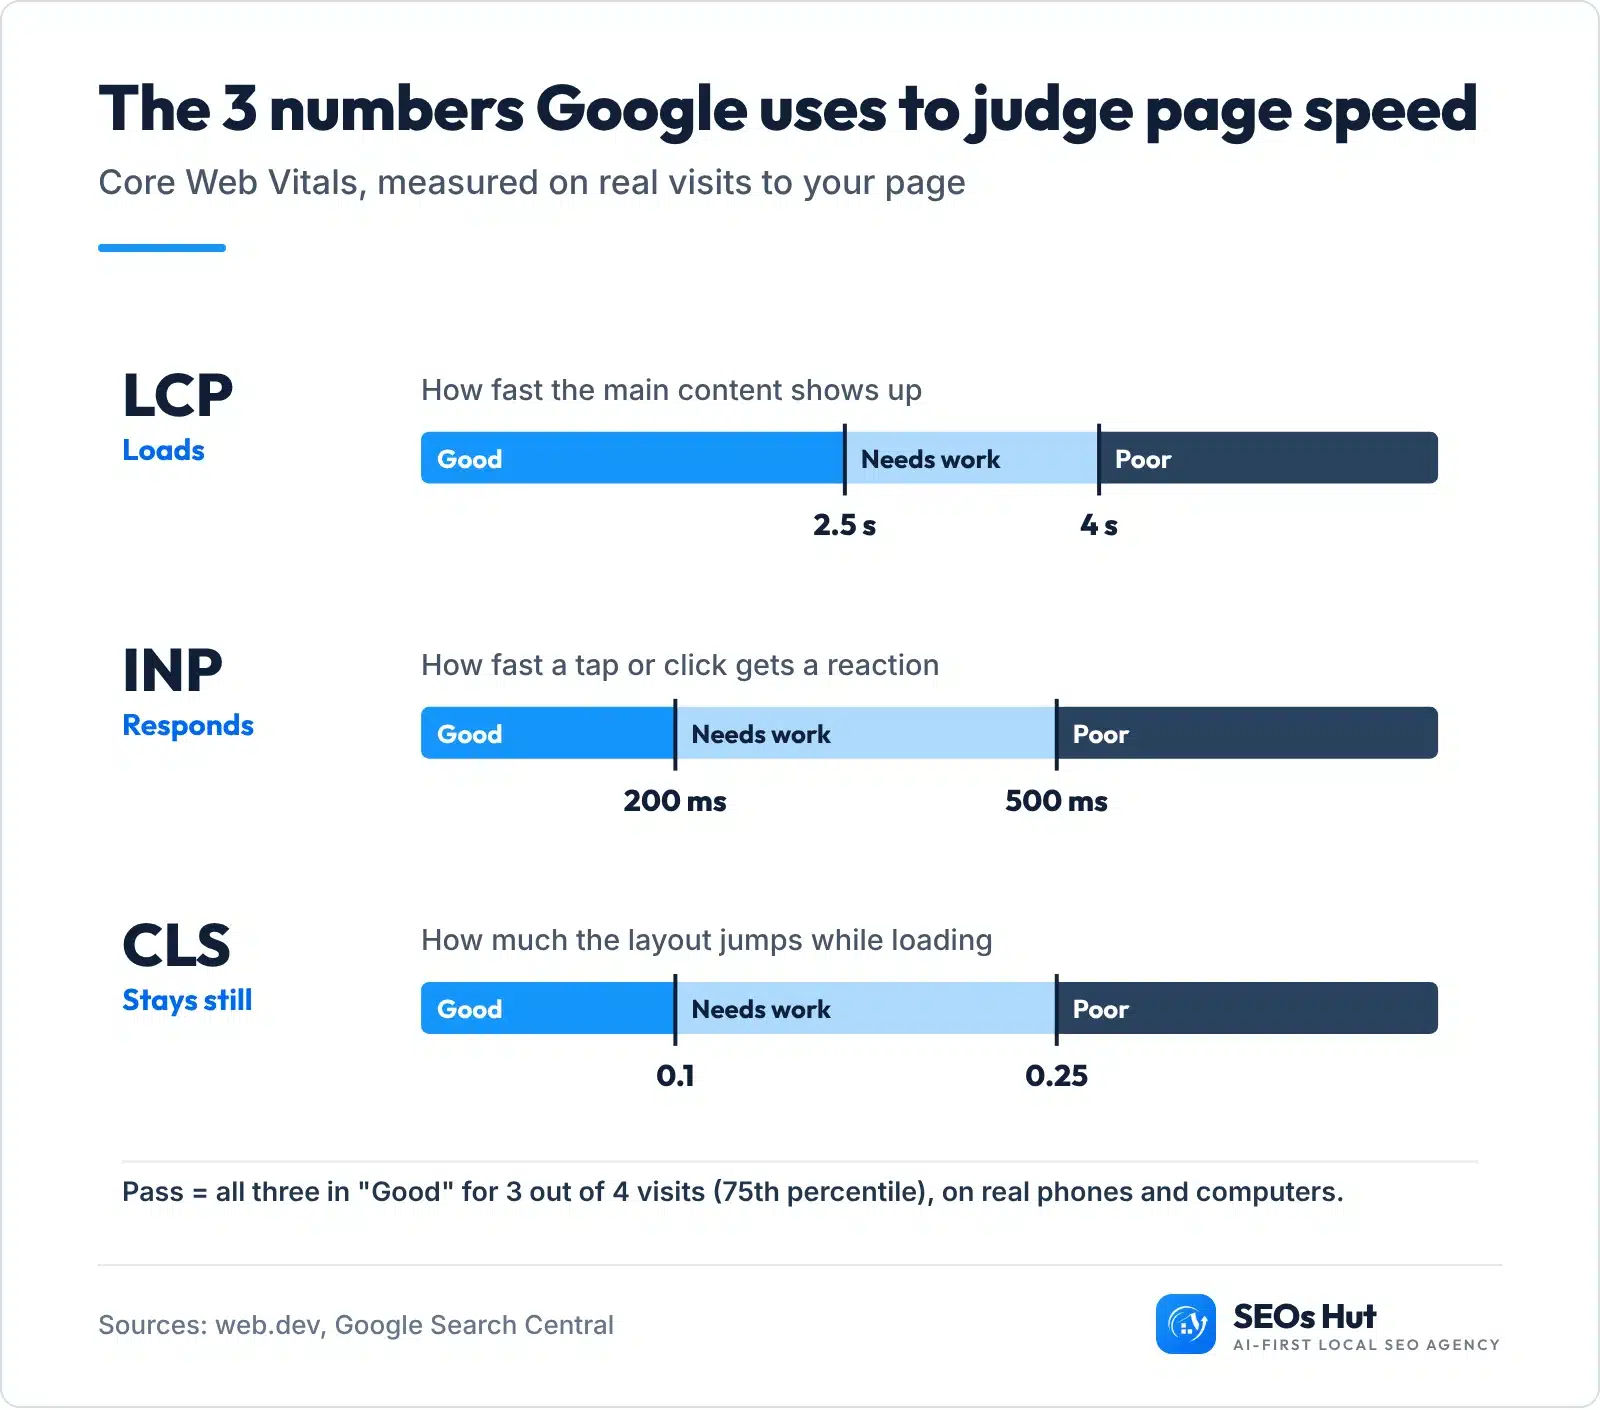
Core Web Vitals are three measurements of what a real visitor experiences on your page. Each one has a “good” line set by Google, measured at the 75th percentile of visits on mobile and desktop separately. In plain words, three out of four visits need to hit the line.
| Number | What it means for your visitor | Good | Poor |
|---|---|---|---|
| LCP Largest Contentful Paint | How long until the main thing on screen (usually the big top image or headline) shows up | 2.5 s or less | Over 4 s |
| INP Interaction to Next Paint | How fast the page reacts when someone taps a button, menu or form | 200 ms or less | Over 500 ms |
| CLS Cumulative Layout Shift | How much things jump around while loading, like a button moving just as you tap it | 0.1 or less | Over 0.25 |
A page passes the Core Web Vitals assessment in PageSpeed Insights when all three are good at the 75th percentile. Anything between the good and poor lines is labelled “needs improvement”. Most sites are not there yet: the HTTP Archive Web Almanac 2025 found good Core Web Vitals on 48% of mobile websites and 56% of desktop websites. On phones, LCP is the one most sites fail (62% good), ahead of INP (77% good) and CLS (81% good).
Why page speed matters more to your customers than to Google
A ranking nudge is the small prize. The big one is the visitor who taps your listing and either stays or goes back to the other businesses in the results. Google’s own research on mobile pages found that 53% of visits are abandoned when a mobile site takes longer than three seconds to load, and that the probability of a bounce rises 32% as load time goes from one to three seconds, and 90% from one to five.

For a local business the most useful number comes from Portent’s study of lead-generation sites: the average conversion rate was almost 40% when pages loaded in 1 second, 34% at 2 seconds and 29% at 3 seconds. Bigger brands see the same pattern. Deloitte’s “Milliseconds Make Millions” study found that a 0.1 second improvement lifted retail conversions by 8.4% and travel conversions by 10.1%, and Vodafone’s A/B test on web.dev showed a 31% better LCP led to 8% more sales.
These studies are a few years old and come from larger sites, so treat them as direction, not a promise for your shop. The direction has not changed in any of them: faster pages keep more of the people you already paid to attract.
We tested 42 San Diego dental websites: what slows local sites down
To see what a typical local business site looks like, we took the website link from each Google Business Profile in the Google Maps results for “dentist San Diego CA” and “dental clinic San Diego CA” on 7 November 2026, and ran each page once through Lighthouse, the same lab test that powers the bottom half of PageSpeed Insights, on default mobile settings. 42 pages loaded and produced a result.
The pattern was clear. On a simulated mid-range phone, the main content took longer than Google’s 2.5 second line on 37 of 42 sites, and longer than 4 seconds on 29. The median page weighed 3.1 MB and 16 were over 5 MB. Only 1 site scored 90 or above in the lab, and 14 scored under 50.
The causes were mostly on the page itself, not the server. Only 4 of 42 had a slow first response from the server (over 600 ms). Instead, 36 loaded files that block the first paint, 20 had at least one image without a width and height, and on 33 sites the main content was an image or a background video, yet 24 of those 33 did not mark it as high priority. On 6 of them it was a video. The good news: none of the 33 lazy-loaded that main element, and none showed layout shift in the lab.

Two cautions. This is a lab test from one server, so the numbers show likely problems, not what Google’s real-user data says about each practice. And it is not a ranking study: we did not compare speed with map positions. You can download the full anonymous dataset (CSV) and check our working.
How to check your page speed the right way
Most people open a speed tool, see one big score, and panic. Here is the order that matches how Google actually measures you. It takes about five minutes.
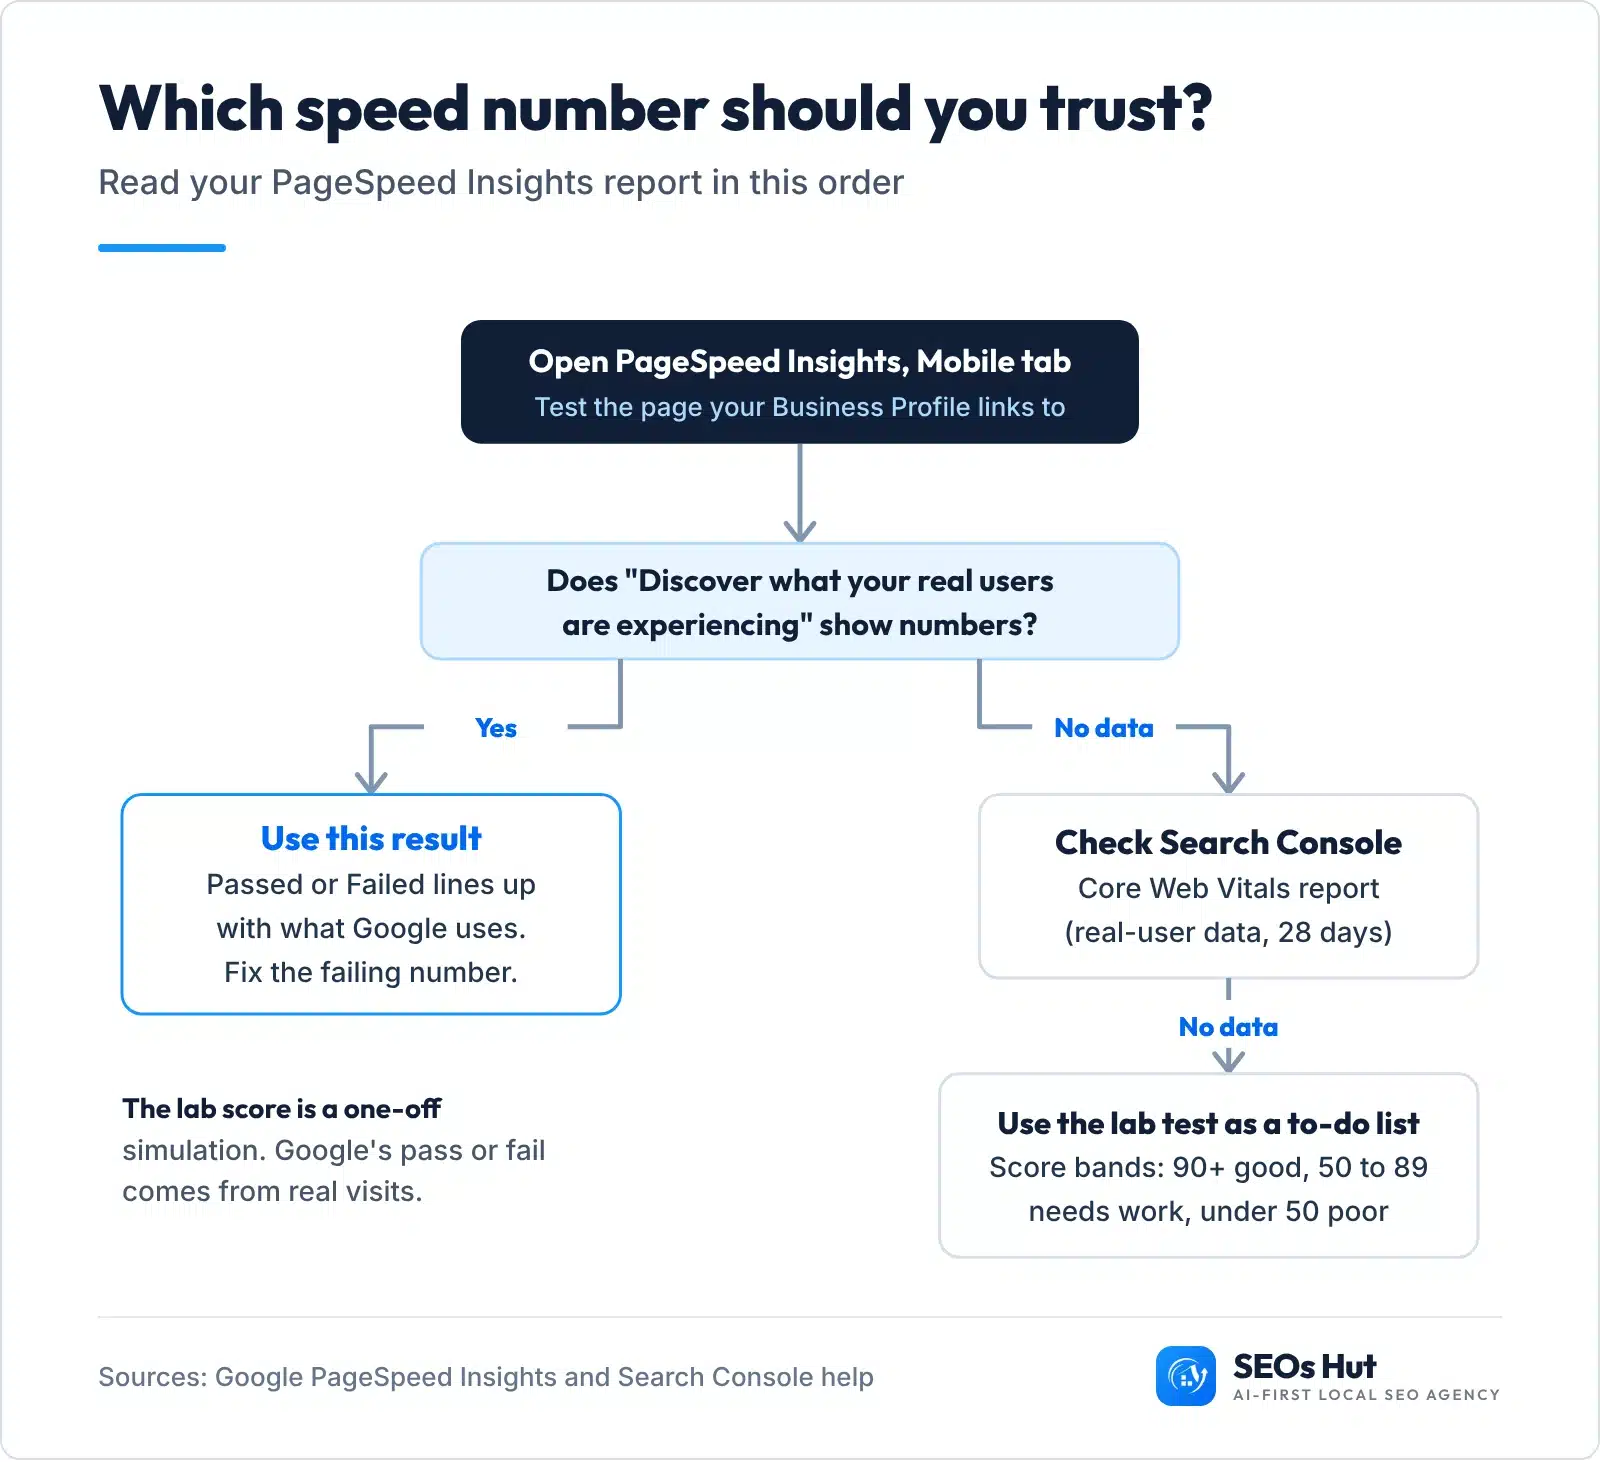
- Test the page your Google Business Profile links to. That is the page local customers land on. Paste it into PageSpeed Insights and keep the Mobile tab selected, because Google indexes and ranks the mobile version of your site.
- Read the top block first. “Discover what your real users are experiencing” is field data from the Chrome User Experience Report. It shows your LCP, INP and CLS and says Passed or Failed. This is the part that lines up with what Google uses.
- If it says “No Data”, that is normal for small sites. Google only shows real-user data once enough Chrome users have visited. Our own homepage showed “No Data” in that block when we checked on 7 Nov 2026. Next, check the Core Web Vitals report in Google Search Console, which uses the same real-user data across your whole site, for the last 28 days.
- Use the lab score as a to-do list, not a grade. The “Diagnose performance issues” block is a one-off simulated test. 90 or above counts as good, 50 to 89 needs improvement and below 50 is poor. Its suggestions tell you what to fix; its score is not what Google ranks.
Not sure where your site stands? Run any page through our free Core Web Vitals Checker, then grab the free one-page page speed fix checklist (PDF). No email needed.
Core Web Vitals fix finder: put in your numbers, get your fix list
Type the three numbers from PageSpeed Insights (real-user block if you have it, lab block if not; the lab test cannot measure INP, so leave it empty) and pick your platform. You get a pass or fail for each number using Google’s lines, and the fixes in the order that will move your worst number first.
Core Web Vitals fix finder
Free, no signup, runs in your browser. Example numbers are filled in; replace them with yours from PageSpeed Insights.
How to improve page speed for SEO, step by step
These steps are ordered by what fails most often on local business sites, starting with the main image. Do them one at a time and re-test after each, so you know what worked.
Step 1. Make the main image load first and light
On most local sites the LCP element is the big photo at the top. web.dev’s top advice for LCP is to make that image discoverable in the HTML, give it priority, and never lazy-load it. Lazy-loading is great for photos further down the page, but on the top image it tells the browser to wait.
- Shrink it: export the photo around 1,600 px wide as WebP (or a well-compressed JPEG). A phone photo straight from the camera is often several megabytes.
- Prioritise it: the top image tag should look like the example below, with
fetchpriority="high", real width and height, and noloading="lazy". - Check your plugin: on WordPress, speed and image plugins often lazy-load every image by default. Look for a setting to exclude the first image or “above the fold” images.
Your top image, before and after
<!-- Before: lazy-loaded, no size, heavy file -->
<img src="team-photo.png" loading="lazy" alt="Our team">

<!-- After: light file, fixed size, loads first -->
<img src="team-photo-1600.webp" width="1600" height="900"
     fetchpriority="high" alt="Our team at the San Diego office">
Step 2. Replace the hero slider or video with one still image
Sliders and background videos are heavy, and the first frame often becomes the LCP element. One strong photo of your team, premises or work, with a clear call button, usually loads faster and converts better than five rotating slides nobody waits for.
Step 3. Give every image and embed a fixed size
Layout shift happens when the browser does not know how much space to keep. web.dev reports that 66% of pages have at least one unsized image. Add width and height to every image, and reserve space for maps, review widgets and booking embeds (CSS aspect-ratio works well). Custom code blocks and third-party embeds are where shifts usually creep in, so check those first.
Step 4. Cut the scripts you do not need
Slow taps (poor INP) usually come from JavaScript: chat widgets, review carousels, pop-ups, social feeds and several tracking tags all running at once. web.dev calls any task over 50 milliseconds a long task. Open your site’s plugin or app list and remove anything you would not pay for again. Keep one analytics tag, one chat tool at most, and load the rest only on the pages that need them.
Step 5. Fix the server and caching
If even a plain text page is slow to start, the problem is before the page: hosting, no caching or no CDN. web.dev lists a CDN as one of its top three LCP fixes because it shortens the time to first byte. On WordPress, a caching plugin plus decent hosting fixes most of this. On hosted builders (Wix, Squarespace, Shopify) you cannot change the server, so spend your time on steps 1 to 4.
Step 6. Re-test, then let Google catch up
Run PageSpeed Insights again; the lab numbers update straight away. Real-user data does not: Search Console looks at the last 28 days. When an issue is fixed, click “Validate fix” in the Core Web Vitals report to start Google’s 28-day monitoring, and check back after that.
Is the PageSpeed Insights score a ranking factor?
Not the way most people think. The 0 to 100 score comes from a lab simulation run once, on one simulated device. The Core Web Vitals assessment in PageSpeed Insights and the Search Console report both use real-user data from Chrome. Google has never said it ranks pages by the lab score, and it warns that chasing a perfect score just for SEO may not be worth your time.
So is a score of 92 good? Yes. In PageSpeed Insights, 90 and above is the “good” band. If your real-user Core Web Vitals pass, moving from 92 to 100 will not change your rankings. Spend that hour on your Google Business Profile, reviews or a better service page instead.
What we saw on our own site
We rebuilt seoshut.com in 2026 and measured before and after. Our website rebuild case study records page load going from 5.4s to 2.4s and the Lighthouse score from 54 to 98, with “−38% bounce” in the first week after launch. The fixes were the same ones in this guide: lighter images, fewer scripts and caching. Speed did not replace good content, but it stopped slowing everything else down.
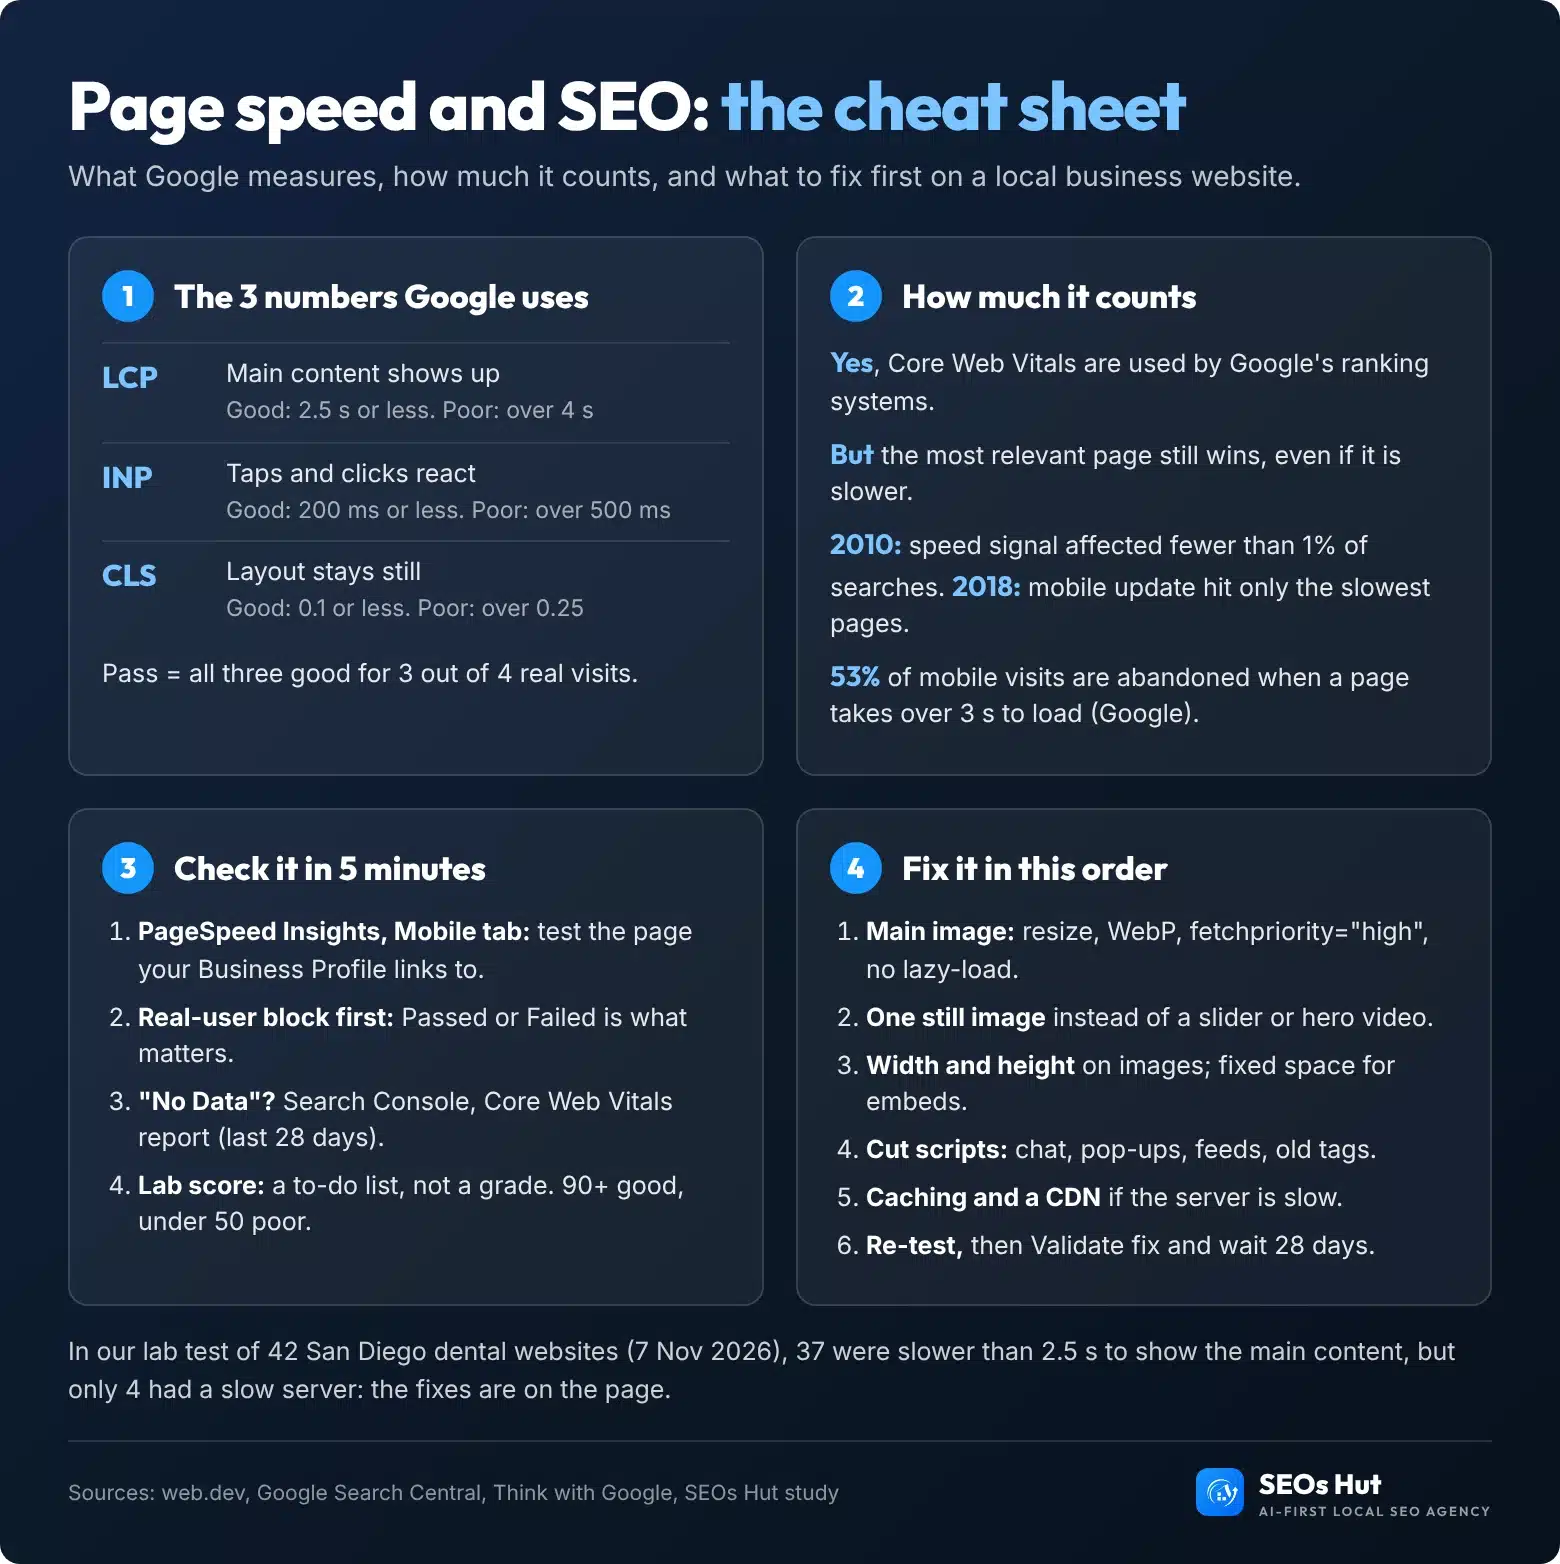
Page speed and SEO cheat sheet
Everything above on one image. Save it, print it for whoever runs your website, or share it.
Want a second pair of eyes on your site?
Our website audit checks speed alongside the things that decide whether a local site gets calls: your Google Business Profile link, mobile layout, schema and content. If the site itself is the problem, our web design team builds sites that pass Core Web Vitals from day one.
FAQs
Is page speed a Google ranking factor?
Yes. Google confirmed site speed as a ranking signal in 2010 and for mobile searches in 2018, and today says Core Web Vitals are used by its ranking systems. It is a light signal: Google still shows the most relevant page first, so speed mostly decides between pages that are equally helpful.
What is a good page load time for SEO?
Aim for a Largest Contentful Paint of 2.5 seconds or less for at least three out of four visits, which is Google’s “good” line. Also keep INP at 200 milliseconds or less and CLS at 0.1 or less. Google’s own research found 53% of mobile visits are abandoned when a page takes longer than three seconds to load.
Does page speed affect local SEO and Google Maps rankings?
Google says local results are mainly based on relevance, distance and prominence, and it does not list speed as a local ranking factor. Your website still matters: it supports your organic rankings, and a slow page loses the people who tap through from your Business Profile before they call or book.
Is an SEO score of 92 good?
Yes. In PageSpeed Insights and Lighthouse, scores of 90 to 100 are in the “good” band. The lab score is a diagnostic, not what Google ranks. If your real-user Core Web Vitals pass, chasing a perfect 100 will not help your rankings in any meaningful way.
Did INP replace FID in Core Web Vitals?
Yes. Interaction to Next Paint (INP) replaced First Input Delay (FID) as a Core Web Vital on 12 March 2024. INP measures how quickly the page responds to taps, clicks and key presses across the whole visit, and a good INP is 200 milliseconds or less.
Sources
All facts checked on 7 Nov 2026.
- Google Search Central: Understanding page experience in Google Search results
- Google Search Central: Understanding Core Web Vitals and Google search results
- Google Search Central Blog: Using site speed in web search ranking (2010)
- Google Search Central Blog: Using page speed in mobile search ranking (2018)
- Google Search Central Blog: Introducing INP to Core Web Vitals
- Google Search Central: Mobile-first indexing best practices
- web.dev: Web Vitals
- web.dev: Defining the Core Web Vitals metrics thresholds
- web.dev: The most effective ways to improve Core Web Vitals
- web.dev: Optimize Cumulative Layout Shift
- PageSpeed Insights: About PageSpeed Insights
- Search Console Help: Core Web Vitals report
- Google Business Profile Help: Tips to improve your local ranking on Google
- HTTP Archive Web Almanac 2025: Performance
- Think with Google: The Need for Mobile Speed (PDF)
- Think with Google: Mobile page speed new industry benchmarks (PDF, 2017)
- Portent: Site speed is (still) impacting your conversion rate
- Deloitte: Milliseconds Make Millions
- web.dev case study: Vodafone